
Episode 11: It's Getting Dry In Here!
/It’s getting droughty up in here!
Have you felt like there just wasn’t as much water around lately…? From lower precipitation to less snow accumulation in the mountains of the Pacific Northwest…it’s getting dry in here!
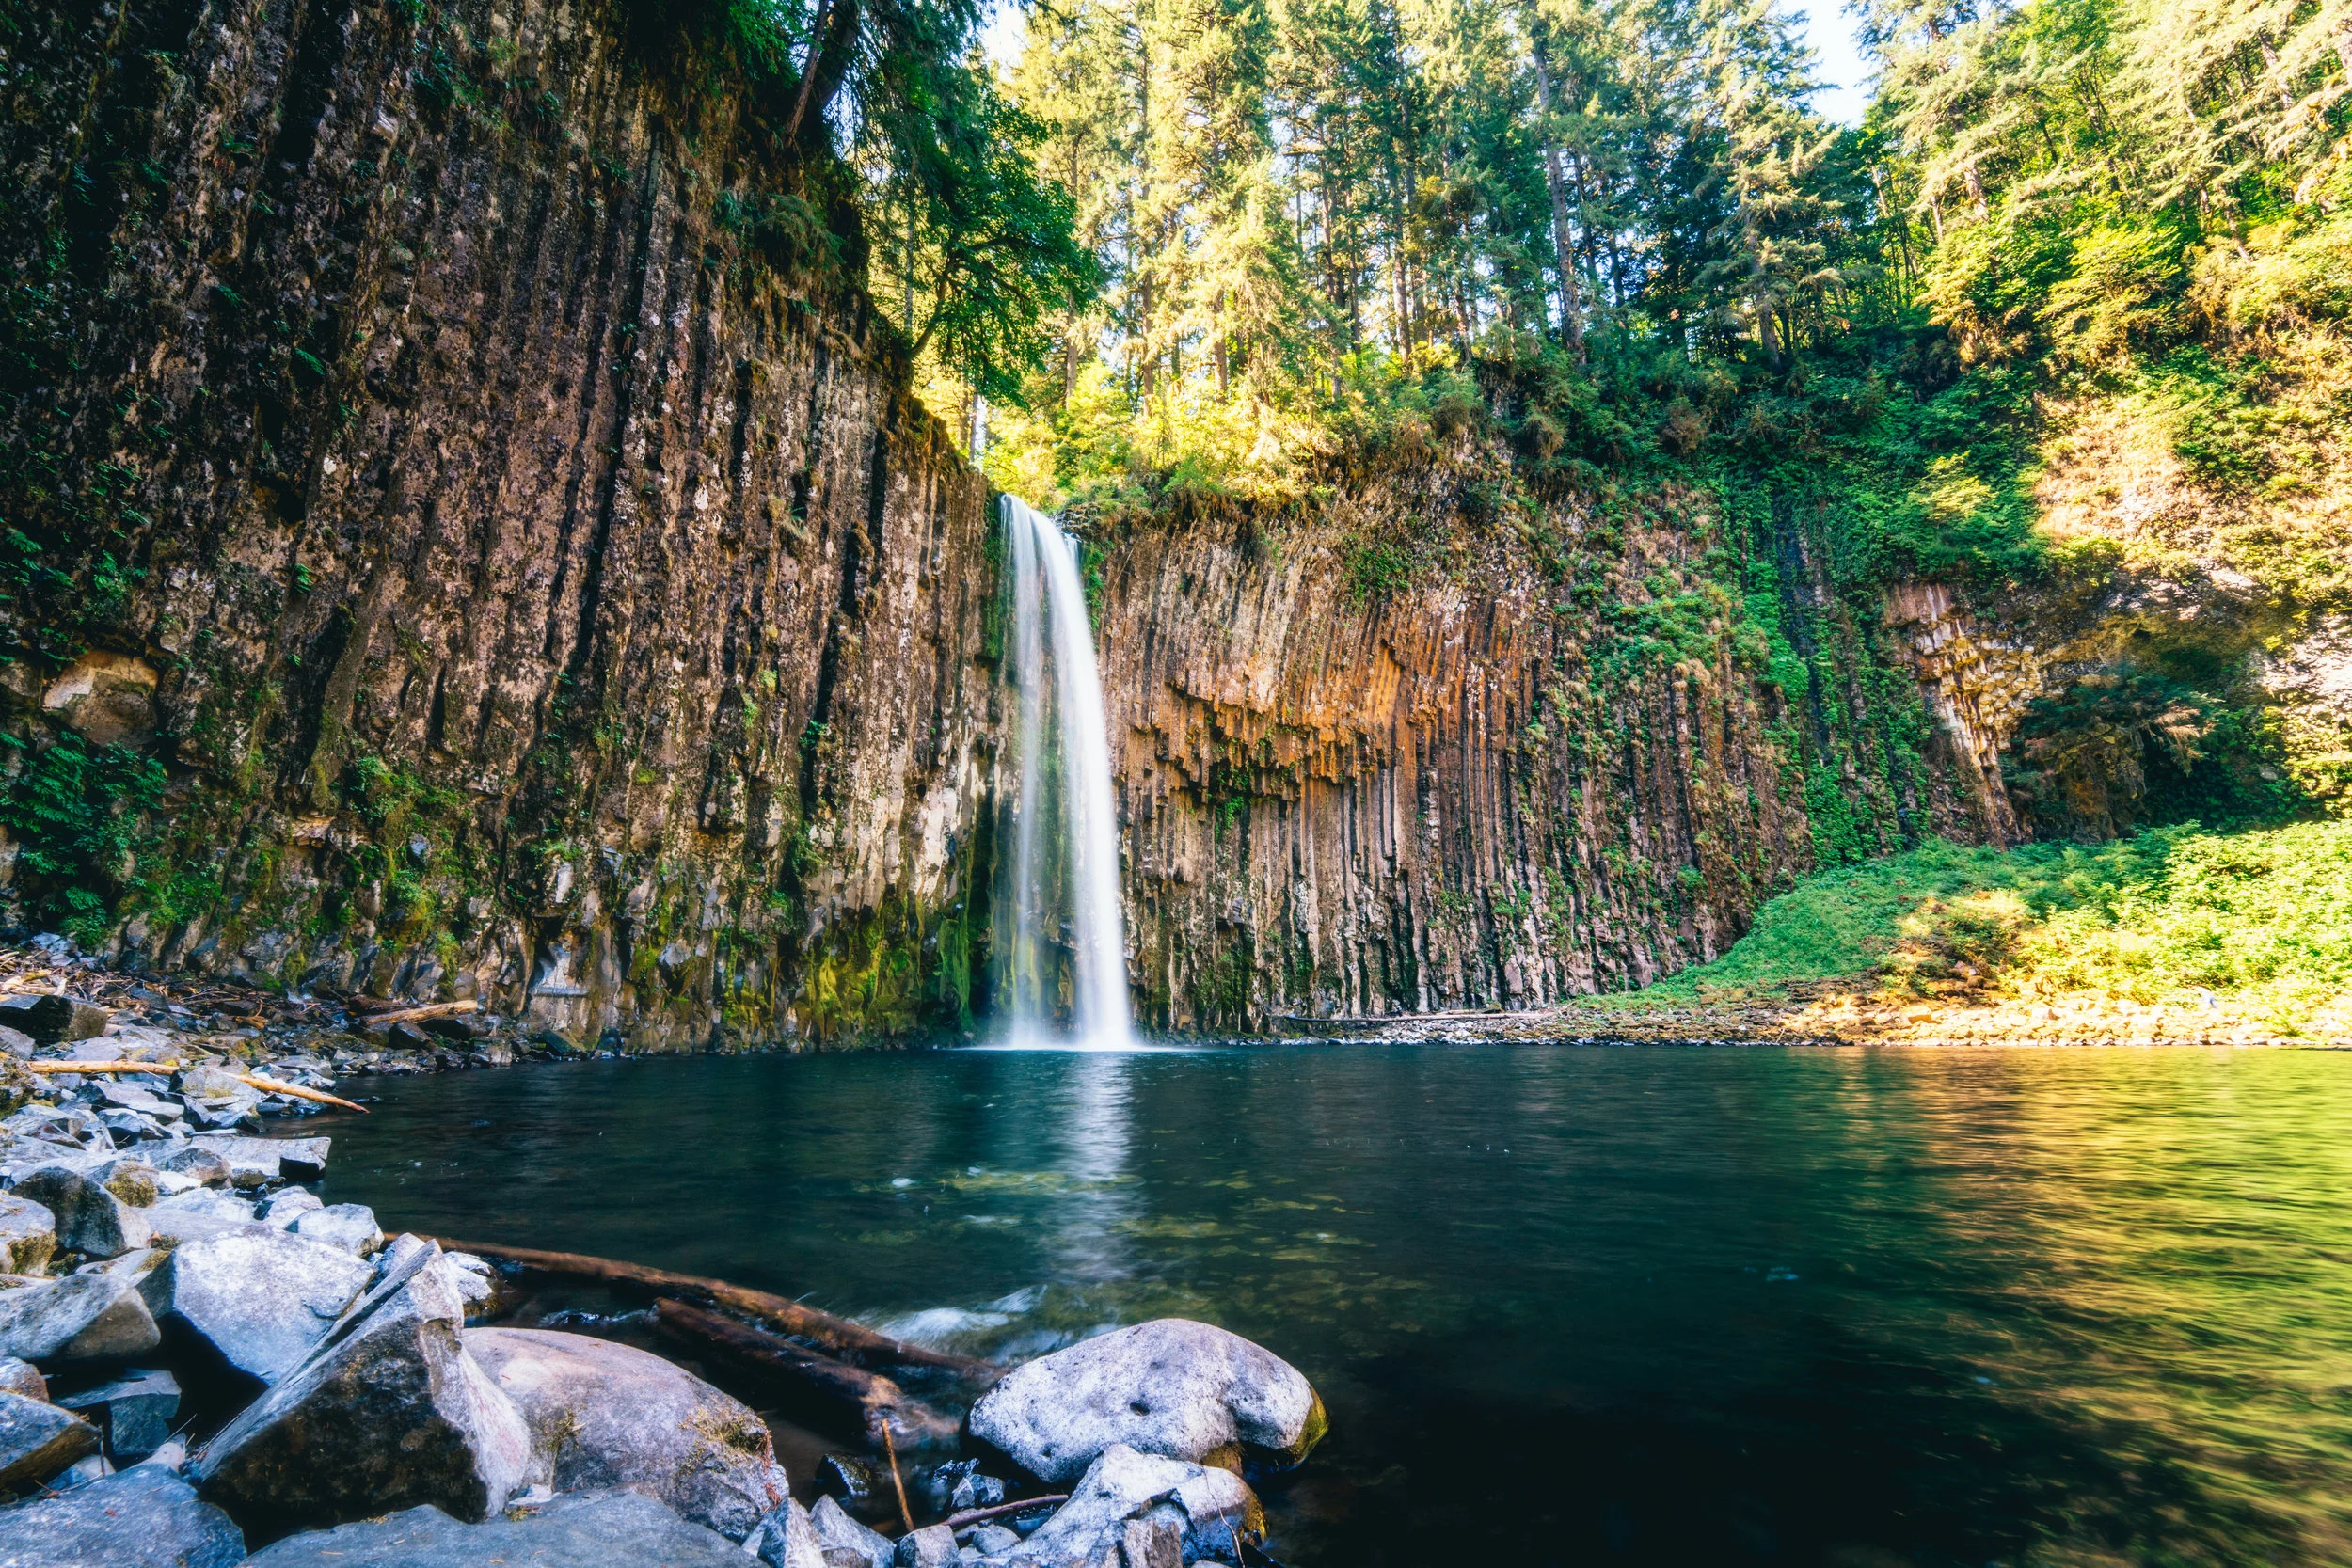
I’m going here during the drought…that waterfall better not dry up!!!
Droughts can be caused by a number of circumstances, but typically the droughts of the Pacific Northwest are impacted by low precipitation coupled with warmer temperatures (El Nino events). Winter snow pack plays an important role in ensuring that we have sufficient stream flows throughout the summer. What we are experiencing in Western Washington this year is a low precipitation drought. The low snow pack coupled with hot temperatures in April melted more snow, earlier than normal. In western Washington, we depend on the slow melt of snow in the higher elevations to keep streams and rivers flowing throughout the summer, when we typically do not see much additional precipitation. Even in May, which is typically still considered part of our rainy season, our area continued to see low monthly accumulations and higher than normal temperatures. In May, Olympia, WA only had 0.9 of an inch of rain, which is only 39% of the average of 2.33 inches of rain.
Most of Western Washington is under the Severe Drought classification from the US Drought Monitor. In addition, the Governor of Washington, Jay Inslee, in 2019, has already declared a Drought Emergency in 27 counties!
In Washington State, drought is defined in statute (RCW 43.83B) as conditions where water supply is anticipated to be less than 75 percent of normal and there is anticipated hardship to water users and uses.
The US Drought Monitor is a federal program created in 2000. They classify the entire US into 6 categories of drought intensity from normal (non-drought) to exceptional drought. With each level of intensity comes additional associated water conservation actions that range from voluntary water use restrictions to widespread water shortages leading to a water emergency.
The U.S. Drought Monitor (USDM) has an on-line map, which shows the location and intensity of drought across the country. The data is updated each Tuesday and released on Thursday. See the GIS section below for links!
U.S. Drought Monitor also evaluates different drought impact categories, which includes agriculture, business and industry, energy, fire, plants and wildlife, public health, tourism and recreation, and water supply.
According to the US Drought Monitor: There are over 5 million people in Washington that are experiencing drought conditions currently and almost 2 million in Oregon. Western Washington is the only area that is experiencing severe drought currently.
According to the Department of Ecology, here's the latest conditions as of June 19, 2019:

Cats to distract you from drought facts
Looking at the 7-day average, more than half of the rivers in the state are showing stream flows in the bottom 10 percent of flows measured for this time of year.
Daytime temperatures in the Yakima River are reaching 80 degrees F., which becomes a thermal block for fish movement.
How can you help? You can report any drought conditions to the Department of Ecology, and water conservation is always important.
Many streams in Western Washington are already below normal volumes for this time of year. Likely these conditions will continue through the summer without additional precipitation. Check out some of the following websites for more information on stream flows.
What is the forecast for the summer weather?
NOAA’s Climate Prediction Center has forecast warmer and drier conditions for the west side of Washington state from June to August. In addition, weak El Nino conditions still exist and there is a 70% chance they will continue through the summer.
Typically areas that are classified by the US Drought Monitor as being under severe drought classification can expect to experience crop or pasture loss, common water shortages and see water restrictions imposed.
What are the expected climate change impacts to the Pacific Northwest Droughts?
As one may be able to assume, climate change is predicted to increase droughts in some areas, by both increasing the temperature and changing the precipitation cycle.
In Western Washington, for example, the total annual accumulation of precipitation is not expected to change drastically. However, the time of year that we see the precipitation will play a critical role in precipitation cycle. Currently, we get precipitation about 9 months out of the year, with the bulk of that coming down as snow in the mountains during the winter. The forecasted precipitation is projected to show up later in the year, when it’s warmer, meaning less snow and less snow pack accumulation in the winter, which will result in lower summertime in-stream flows. This will be compounded by warmer temperatures, which will exacerbate future drought conditions.
What does a drought mean for the Pacific Northwest?
According to the Department of Ecology’s website:
Drought conditions expose different populations and communities to different levels of vulnerabilities.
By declaring a drought emergency, the Department of Ecology can offer vital support to these communities. This designation allows Ecology to expedite emergency water right permitting. For instance, one farmer may lease water to another farmer and Ecology can expedite that transfer.
It also allows them to make funds available to address hardships caused by drought conditions. On June 4, Ecology announced a grant program to help with drought response.
Drought can result in water shortages for agriculture, energy, people and ecosystem services:
Agriculture
Water rights can be impacted, with senior water rights, including in-stream flow, having the “first dibs” on water and then if there is not enough water left in the streams, junior water right holders may not be able to access the water.
Energy
Hydroelectric power can be impacted by lower snow pack.
People
Increases in water use due to summer irrigation and increased water use around people’s homes. Water withdrawal from surface and ground water can be impacted by less precipitation and an increased demand for water from multiple sources.
Ecosystem Services

Fish - low flows and subsurface flows, increased temperatures, decreased dissolved oxygen (DO), and increased biological activity (growth) can all have a negative impact on fish survival and in some cases can lead to fish kills.
Stressed plant communities - Western Washington has recently seen an increase in plant impacts from multiple years of higher heats and less precipitation; these include iconic northwest trees such as madrona, cedar, big leaf maple and other plants such as salal, which has seen a huge die back on Vancouver Island.
Increased fire risk due to lower precipitation and higher temperatures. Low soil moisture content and low humidity also contribute to increased risk of wildfire.
OSU-extension developed a cool handout that shows some best practices to recover from a wildfire.
To learn about fire and wildfire preparedness, listen to Episode 9: Fire Must BURN!
Learn more about how the City of Port Orchard stopped any further construction in the new McCormick Woods development due to concerns of having insufficient drinking water supplies. This is a big deal for a local municipality, since permitting is an important revenue source. Check out this interview with KOMO news or this article in the Kitsap Sun Newspaper to learn more about the City’s plans. The City is continuing to work with the developer and the City of Bremerton to find a solution.
What can you do to minimize the impacts of a drought?
As an individual, conserving water is the best way to mitigate for the impacts of drought.
We suggest you start with a water audit to calculate your water use footprint. We used the www.watercalculator.org website to calculate our average water footprint per day. Basically you answer a series of questions about your typical indoor, outdoor and virtual water use.
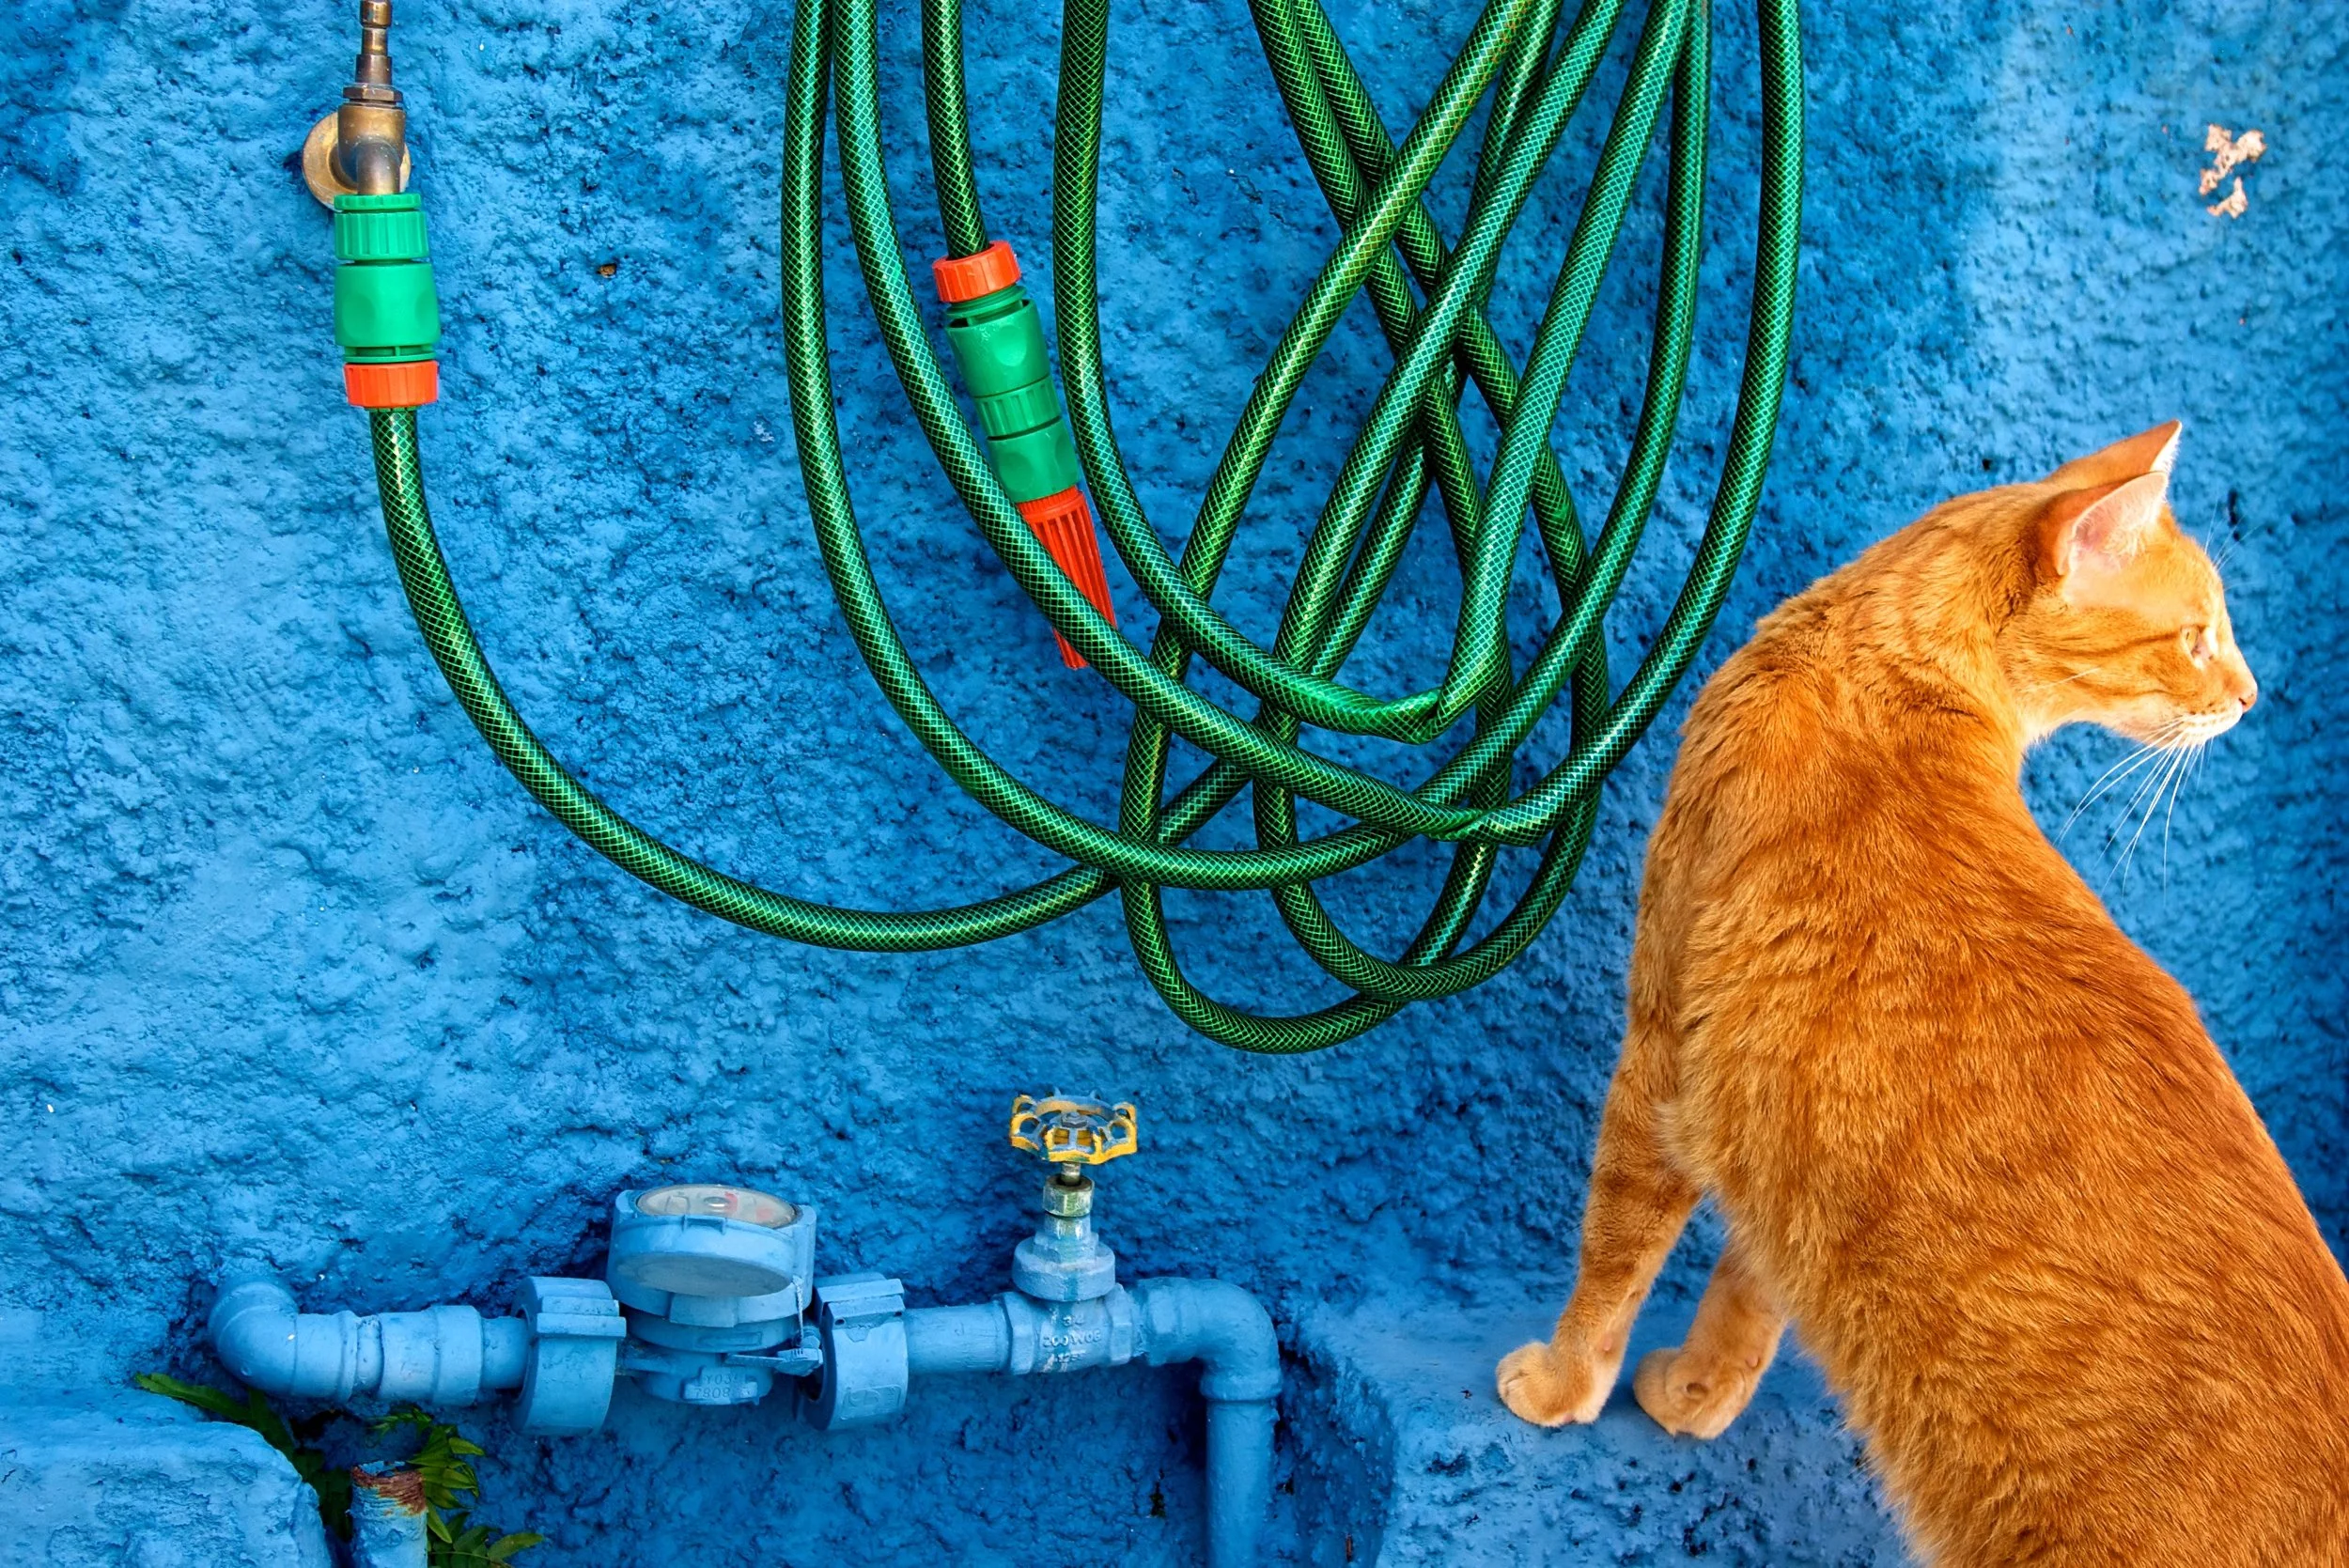
Cool cats use water wisely!
Some interesting things discussed in the calculator include the virtual water use items. For example:
It takes an enormous amount of water to produce animal products like meat and dairy, because livestock and poultry in the US eat large amounts of water-intensive feed – usually corn and soybeans. Agricultural withdrawals account for 70% of water use around the world.
Because irrigation-related water consumption is so high, it’s important to make water-wise food and textile purchases!
Cotton takes a lot of water because it is typically grown in arid regions, which require irrigation.
It’s good to think about how goods are moved around the planet and consider how much water is moved and consumed in the process, even though it’s hidden from sight!
Things like smart phones take over 3,000 gallons of water to produce, which is associated with both their manufacturing and disposal of wastewater that is diluted with freshwater to meet water quality standards.
Did you know that it takes 22 gallons of water to make one pound of plastic? This means it takes twice as much water to produce a plastic water bottle as the water that is contained in it!
How can you save water?
According to the water calculator website, these 5 simple steps can help you save water:
STEP 1: Change your diet
It takes water – a lot of it – to grow, process and transport your food. When you eat lower on the food chain, eat more whole foods and waste less food, you also save water.
STEP 2: Cut indoor water use
Every day, you rely on water for a wide variety of uses around the house. There are lots of opportunities to cut back on water use in the kitchen, bathroom and laundry room and even by fixing leaks.
Toilets are the largest water consumers in da house! Typically they account for about 30% of overall household water use. Using a low flow toilet, fixing any toilet leaks and considering letting it mellow are all ways to minimize water use. A leaking toilet can waste 200 gallons per day!
Fix leaks! Leaks just waste water and even a small drip can add up to a lot of water over time.
Turn off the water when you are brushing your teeth or lathering your hands.
Keep showers short and consider skipping a day every once in a while, in the name of water conservation, of course! Replace shower heads that have a flow rate greater than 2.5 gallons (9.5 liters) per minute (the current national energy policy act standard).
If the shower head is not labeled, the flow rate can be checked by catching the water in a 1-gallon (3.8 liters) bucket. If it takes less than 24 seconds to fill up, the shower head flow rate is more than 2.5 gallons (9.5 liters) per minute. The U.S. EPA WaterSense program labels efficient shower heads that use a maximum 2.0 gallons (7.6 liters) per minute.
High Efficiency dishwashers typically use less water than doing dishes by hand, but make sure to do full loads. The same goes for the laundry; having a high efficiency washer can save a lot of water.
STEP 3: Use less water outdoors
Of all the residential water we use in the US, on average we use about a quarter outdoors. In some western states it’s half to three-quarters, primarily for lawns and gardens. A few simple steps can reduce your outdoor water consumption, so tighten those taps, eliminate those leaks and use water wisely.
Outdoor water use accounts for 30% of the average daily water use in the United States! In hot summer months or dry areas, outdoor water use can account for up to 70%.
Choose drought tolerant plant species and minimize turf and lawn areas. WSU-extension has some great resources for drought tolerant plants.
Use a timer to prevent over-watering; most lawns need 1” of water per week. Watering longer promotes deeper root growth, which makes the grass more resilient.
STEP 4: Save energy, save water
Water and energy are linked. It takes water to make energy (electricity and transportation fuels) and it takes energy to move, heat and treat water. When you save energy you also save water.
STEP 5: Change buying habits
Practically everything you buy, use and consume has a water footprint because it took water to process and transport it. Being thoughtful about purchases, reusing where you can and recycling can reduce your water footprint.
Try to consider the water footprint of various products that you purchase; remember that bottle of water took a lot more water to produce than just the water inside of it! Meat and textile production are very water intensive.
Also, you can become a water detective, by paying attention to your water bill! Do you see an unexpected increase in water use? If so, check for leaks! Knowing how much water you typically use will help you determine if there is a concern or you have been able to reduce your water use!
Still want to know more?!
Ya, cool cats usually do…check out these links for lots more information!
The Alliance for Water Efficiency Drought and Drought Response, Business and Industry tips and Water Conservation Tips
Washington State Department of Health Drinking Water and Drought
GIS Time! How do they make that cool US Drought Monitor Map?

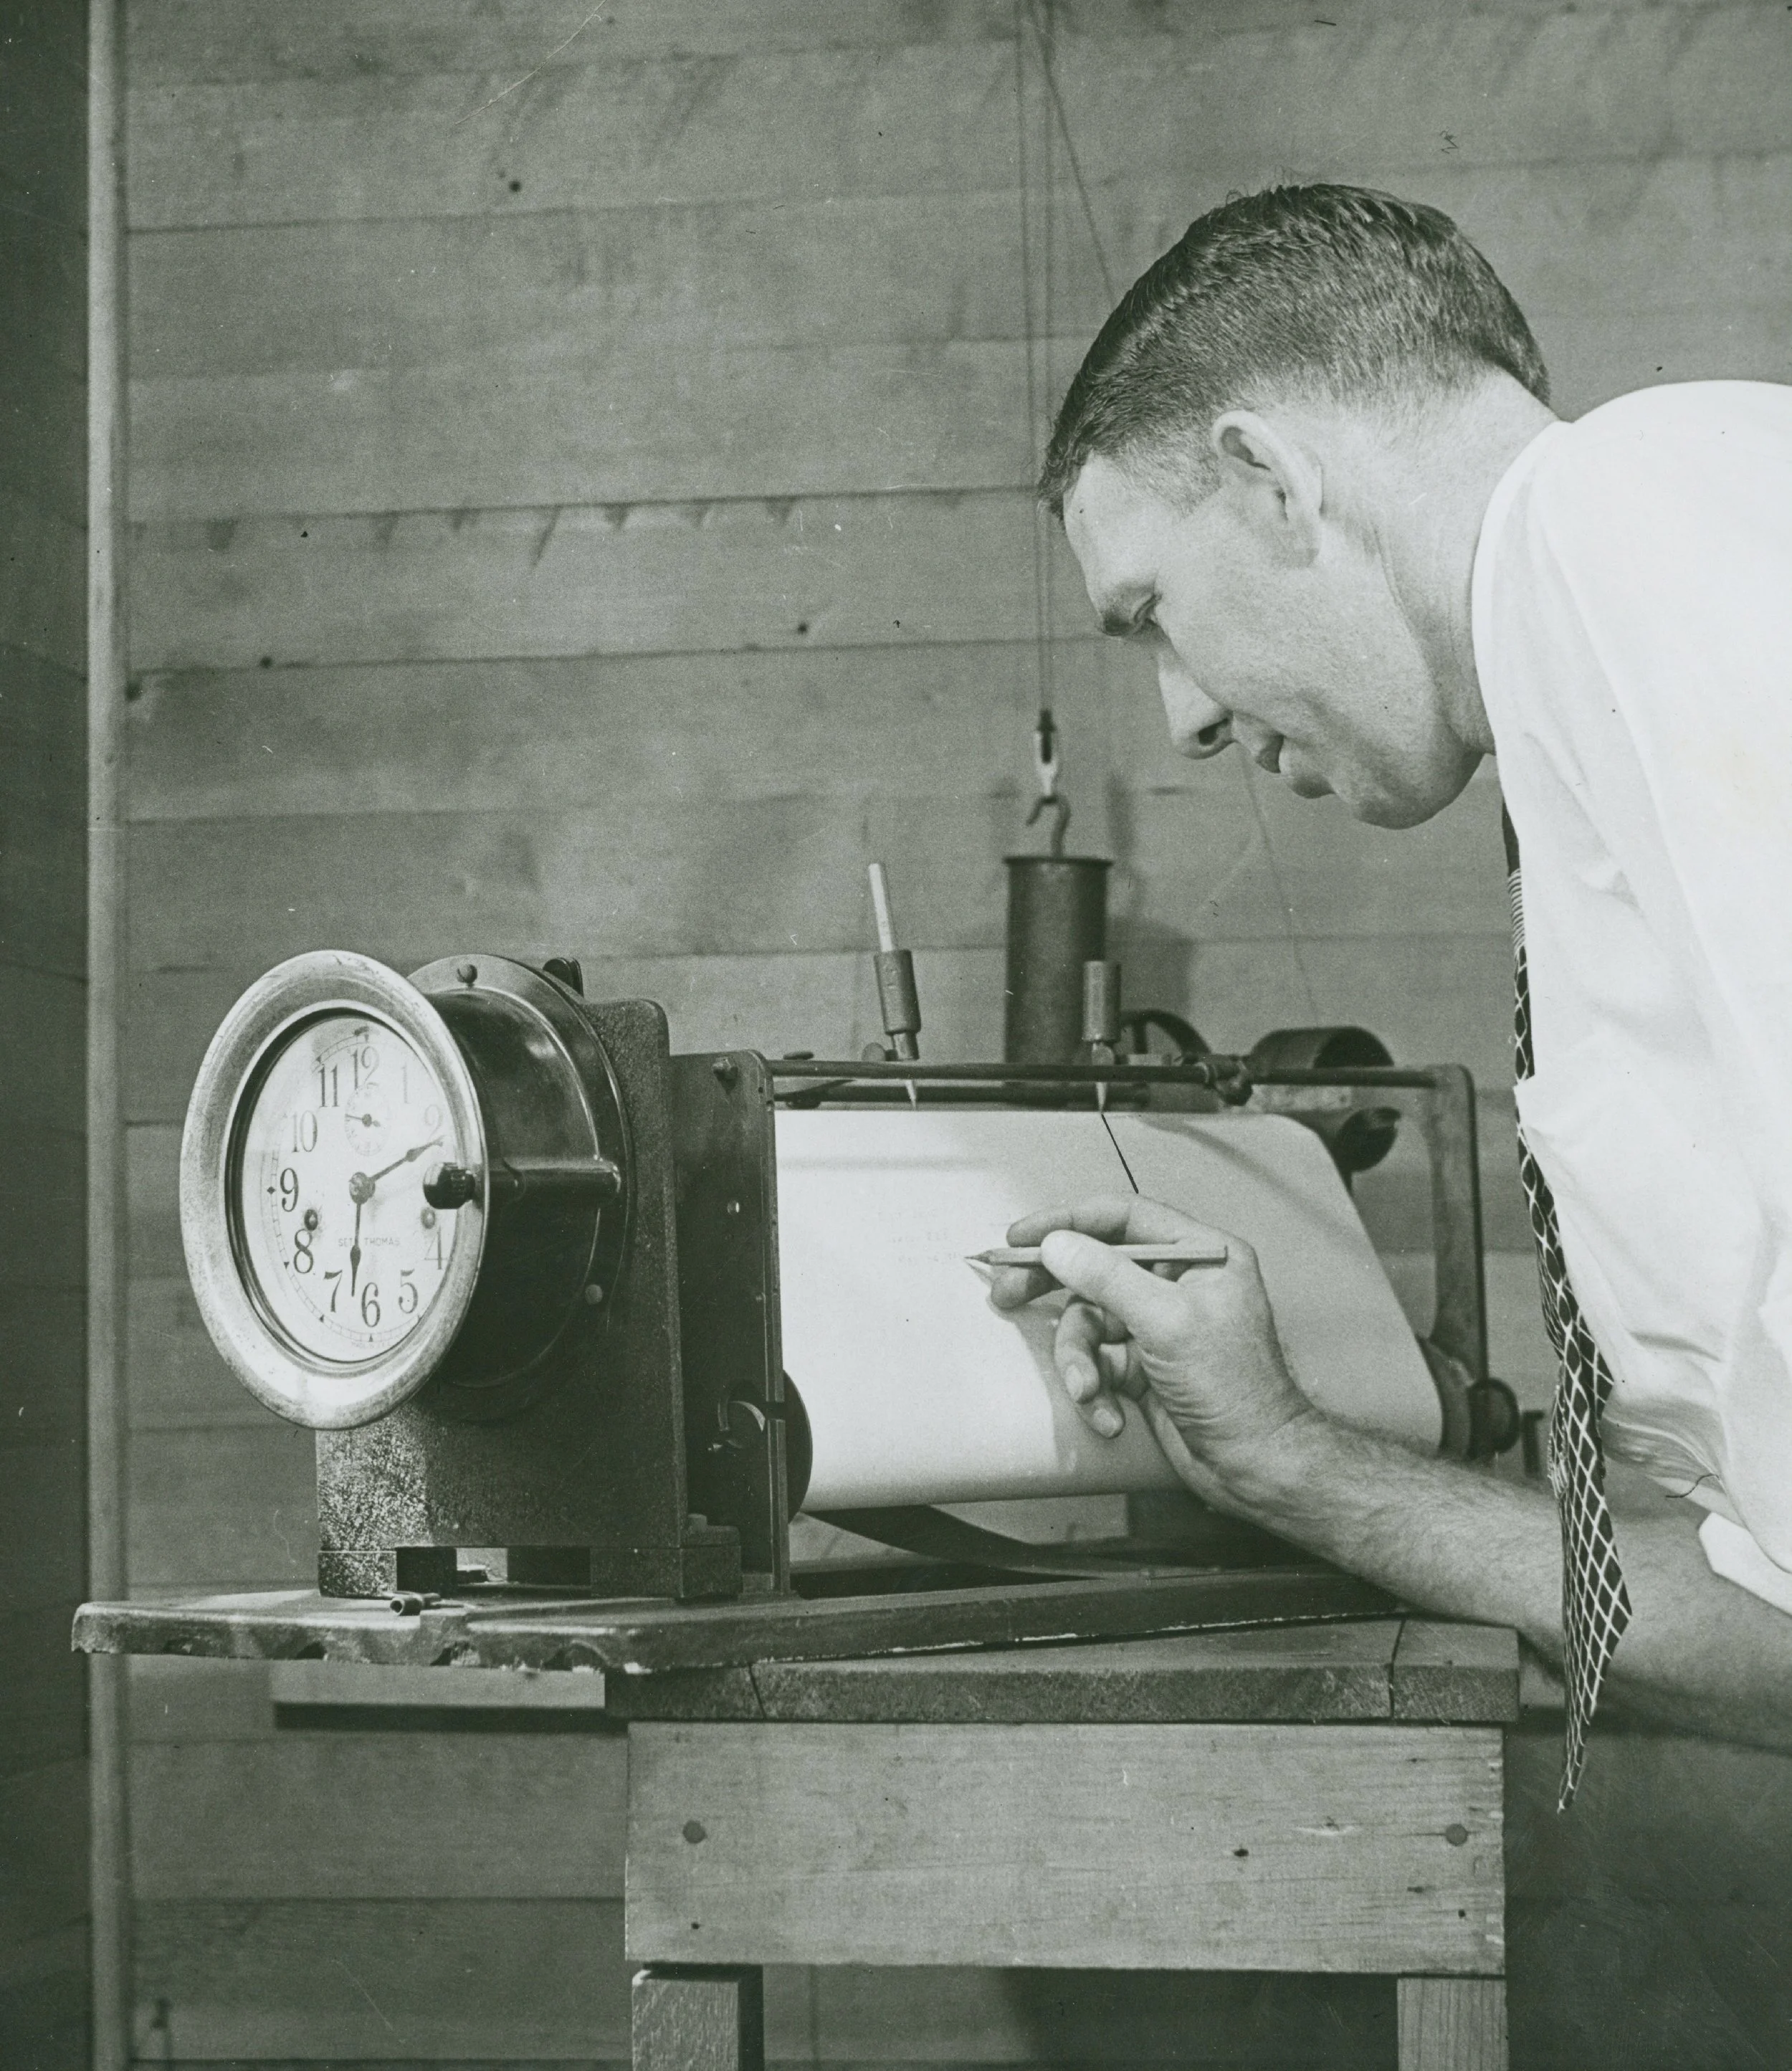
The Magical Mapper around August of 1999!
The information for this segment of the podcast comes from a slide show given by Eric Luebehusen, a meteorologist and one of the authors of the US Drought Monitor (USDM) Map. He does a fabulous job of explaining the history of the map and how it’s created today, so I won’t repeat it all here, and we won’t have a separate GIS Tools blog this week.
The USDM map started out as a really pixelated drawing back in August of 1999, but eventually moved over to GIS and uses a lot of science-based layers today. They still create all of the drought shapes by hand, which takes 10-20 volunteer hours per week! See the whole slide deck here.
Citizen Science: Drought Reporting and Weather Stations!
While they don’t use automated rain gauges, you can submit your report digitally!
Are you being affected by drought? You can submit a report about how lack of water is affecting you through the Drought Impact Reporter from the National Drought Mitigation Center at the University of Nebraska. The format of the report is a Survey123 app, which the Magical Mapper has mentioned before on the podcast. You can also attach photos and report on any and all of the questions they ask about, which include agriculture, municipal water supply, and fish and wildlife habitat impacts. You can then see the reports in an awesome story map! This is just a starting point for interested parties to see what’s going on, and is based solely on media reports and subjective volunteer reports.
Want to have a bit more impact? You can become a CoCoRaHS reporter! CoCoRaHS stands for Community Collaborative Rain Hail and Snow Network. This network of volunteers have purchased high quality rain gauges that cost around $35 and report precipitation amounts each day. You do need to commit to reading and emptying your rain gauge at the same time every day. These reports are then used by a wide variety of people, including the National Weather Service, climatologists, researchers, insurance industry, forensic detectives, and the US Drought Monitor, just to name a few. Even readings of 0 rain are very important and help researchers study and identify drought conditions.
Thanks for joining us!
As always, please rate, review and subscribe on Apple Podcasts, Stitcher, or wherever you get your podcasts. Please let us know what you think at outalivepodcast.com or facebook.com/WillWeMakeItOutAlive. If you like the podcast, please tell all of your friends! And family! And co-workers! And strangers!
See you next month!